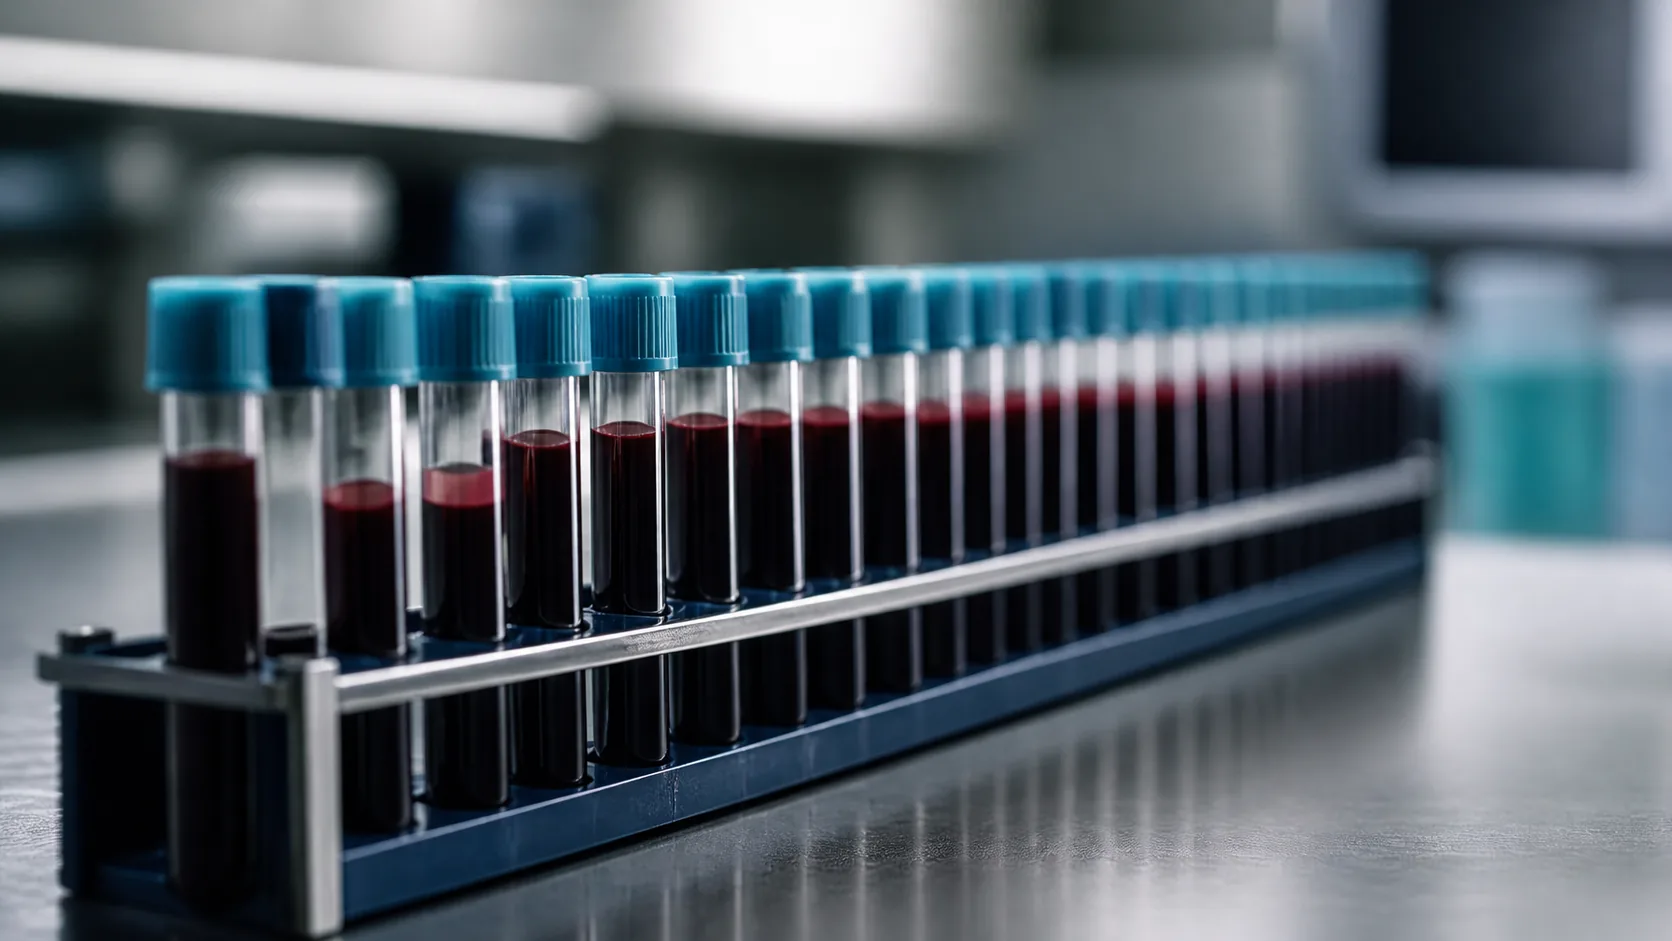
How to estimate blood age with the Bortz method
The Bortz method estimates the biological age of your blood from a panel of routine laboratory values, so it begins with a venous blood draw at a clinic or lab, not at home. It comes from work published by Bortz and colleagues in 2023, which used the UK Biobank cohort to compare ways of turning ordinary blood chemistry into an age in years. The part worth reading is the gap between that age and your real one.
What you need
- Your chronological age and sex.
- A venous blood sample, drawn fasting if the panel includes glucose and triglycerides.
- Kidney markers: creatinine, cystatin C, urea.
- Liver and protein markers: albumin, total protein, alkaline phosphatase, gamma-glutamyl transferase, ALT, AST, bilirubin.
- Metabolic markers: fasting glucose, HbA1c, urate.
- Lipids: total cholesterol, HDL cholesterol, triglycerides.
- Inflammation: C-reactive protein.
- A complete blood count: hemoglobin, red cell count, mean cell volume, red cell distribution width, white cell count, lymphocyte percentage, platelets.
The model draws on roughly two dozen values, and published accounts differ on the exact count, so treat the calculator’s own form as the definitive list. Cystatin C, HbA1c and C-reactive protein are the ones most often missing from a standard panel; request them by name. Enter every result in the units the form asks for, because a wrong unit returns a plausible-looking number that is simply wrong.
How the measurement works
Each marker is multiplied by a weight fitted in several hundred thousand UK Biobank participants, the weighted values are combined, and the total is rescaled into years so that a typical person lands near their own age. The score says where your blood chemistry sits relative to people whose age is known. The arithmetic is not worth doing by hand, which is what the Bortz Blood Age Calculator is for. Each input pushes in the direction you would expect.
| Input | Which way a higher value usually pushes the estimate |
|---|---|
| Albumin, total protein | Younger |
| Creatinine, cystatin C, urea | Older |
| Fasting glucose, HbA1c | Older |
| C-reactive protein | Older |
| Alkaline phosphatase, gamma-glutamyl transferase | Older |
| Red cell distribution width, mean cell volume | Older |
| Hemoglobin | Younger |
| White cell count | Older |
| Lymphocyte percentage | Younger |
The table gives direction only; how much each marker contributes belongs to the model. Not every input is monotonic either, so no single value is a lever for the score. The breadth of the panel is what separates this approach from the nine-marker calculation behind the PhenoAge Calculator — biological age from a blood test, the model it is most often compared with.
How to read the result
You get an age in years, and the raw figure means little on its own, because most of it is carried by your chronological age. The gap is what carries information. Below your chronological age means your panel resembles that of younger people in the reference cohort; above means the opposite; near zero means you sit where your birth year predicts.
There are no agreed bands that turn a gap into a verdict, so be wary of any page offering one. A small gap on a single draw is noise: a cold, a hard workout, dehydration or a different analyzer will each move several inputs at once. A gap that holds across repeat tests, taken fasted, when you are well and at the same lab, is the one worth raising with a clinician.
What it does not tell you
It does not tell you how fast you are aging. It reads your blood on one day against a reference population, so a raised score can reflect a treatable problem, a recent illness or a drug rather than accumulated aging. Statins, allopurinol, corticosteroids and hormonal contraception all move inputs this model uses.
It cannot see what never reaches the blood: arterial plaque, bone density, muscle mass, early cognitive change, most cancers. Nor is it interchangeable with the other clocks, since blood age, epigenetic age and vascular age routinely disagree in the same person. The trade-offs between methods are laid out in Biological age tests: what to measure and how to choose a method.
Finally, mind who it was fitted in. UK Biobank volunteers are mostly middle-aged, mostly of European ancestry and healthier than the general population, so performance in younger adults, other ancestry groups and acutely unwell people is less established. Separating risk across large groups is not the same as predicting your future.
Related reading
- What Biological Age Is and How to Measure It
- Which Blood Tests Reflect Aging and How to Read Them
- PhenoAge
- Biomarker of aging
Disclaimer. This article is for information only and does not replace medical advice. Talk to a qualified clinician before changing anything about your health.