BMI vs Body Fat Percentage: Which to Track
By Longevity Lab · Published: August 23, 2026
Based on peer-reviewed research — full source list at the end of this article. This is educational information, not medical advice.
- BMI has one virtue body fat percentage lacks: it is reproducible to the decimal, on any scale, anywhere.
- Body fat percentage measures the tissue that carries the risk, but every practical method has meaningful error.
- At BMI 30, sensitivity for detecting excess body fat is around 50% — half of people with excess fat are missed.
- The two disagree most in the 23–30 range, which is where most adults sit.
- Track BMI for trend and body fat for truth, and let waist circumference arbitrate between them.
Track BMI when you need a number that is free, instant and reproducible; track body fat percentage when you need to know what your weight is actually made of. The two are not competitors so much as different instruments — BMI is precise but measures the wrong thing, and Body fat percentage measures the right thing imprecisely. Knowing which error you are dealing with is most of the skill in reading either one.
What each one actually measures
BMI is weight divided by height squared. It has no input for tissue type, so a kilogram of muscle, a kilogram of visceral fat and a kilogram of retained water all count identically. What it gains from that crudeness is perfect reproducibility: two people measuring the same person will get the same BMI.
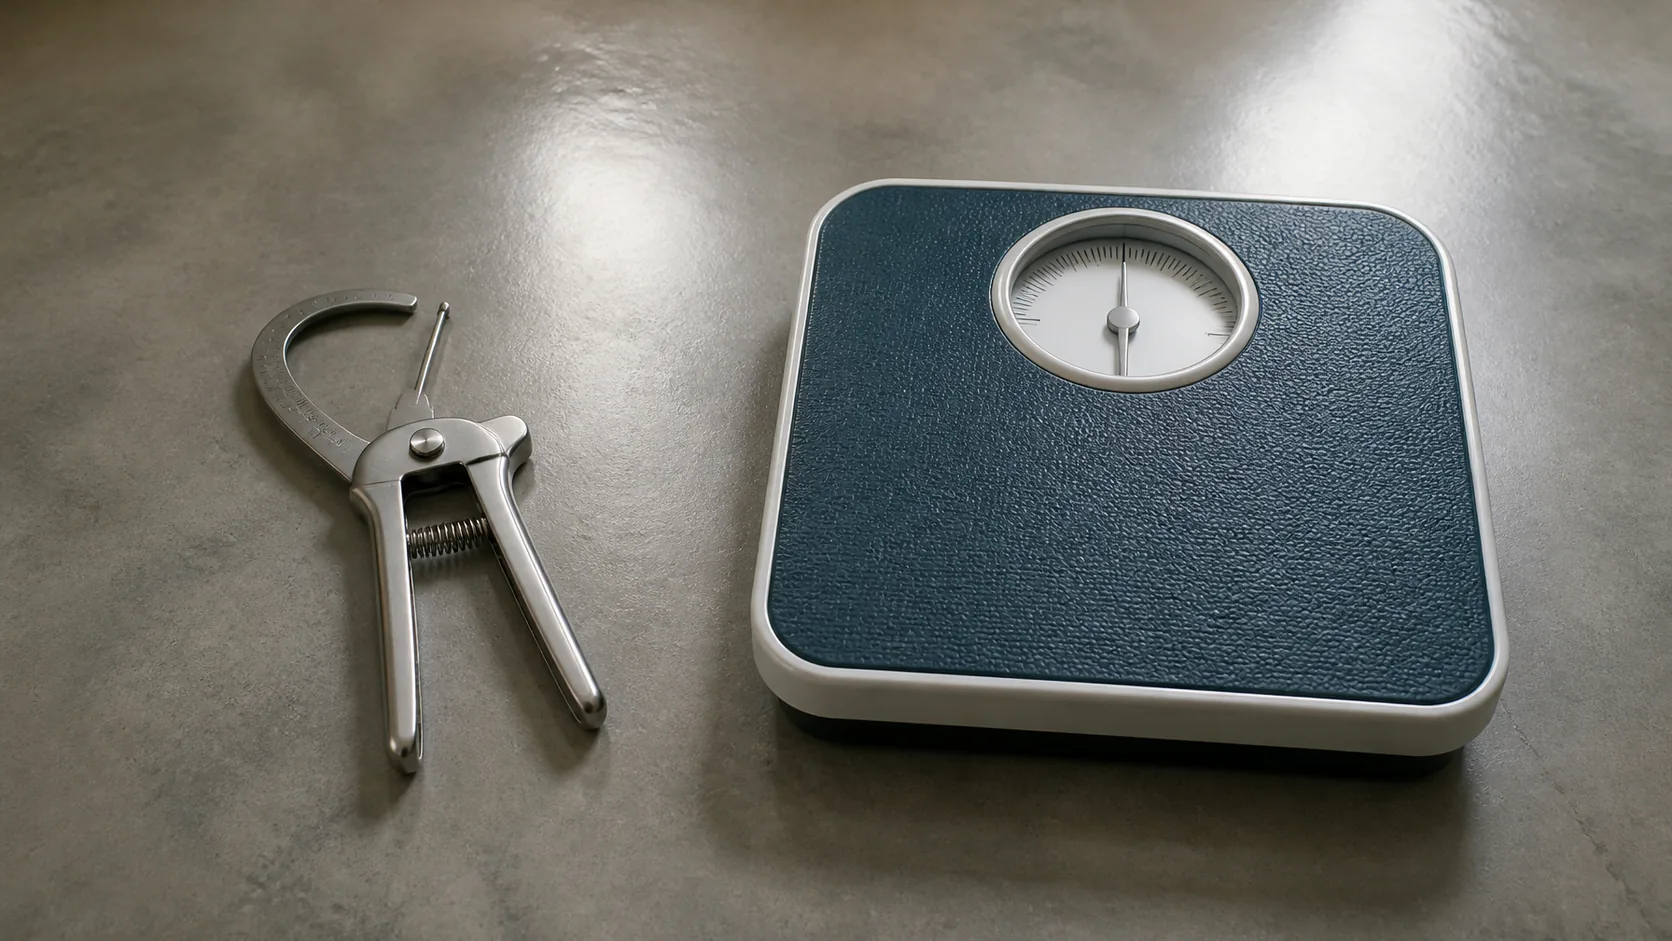
Body fat percentage is the fraction of total mass that is fat tissue — the part that carries the metabolic risk. But it cannot be measured directly outside a laboratory. Every practical method estimates it from something else: impedance from how electricity crosses tissue, calipers from skinfold thickness, DEXA (dual-energy absorptiometry) from differential X-ray absorption. Each estimate carries its own error, and the errors are not small.
So the trade is: a precise measurement of a poor proxy, against an imprecise measurement of the right quantity.
How badly BMI misses
The scale of the mismatch is well quantified. In a study of over 13,000 US adults, using BMI at a threshold of 30 to identify people with excess body fat produced a sensitivity of roughly 50% — half of the people who did have excess adiposity were classified as not obese. Specificity was high, meaning a BMI over 30 rarely calls someone obese who is not.
That asymmetry is the practical point. A high BMI is usually right; a normal BMI is often wrong. If your index is 33, it is very likely telling you the truth. If it is 24, it may be missing a substantial fat mass sitting where the index cannot see it.
The disagreement clusters in the middle. Below 18.5 and above 32, BMI and body fat generally agree. Between about 23 and 30 — where most adults live — they diverge constantly, and that band is exactly where a decision might hinge on the number.
How badly body fat measurement misses
| Method | Typical error vs DEXA | Practical notes |
|---|---|---|
| DEXA scan | reference standard | Clinic only; also reports regional distribution |
| Air displacement (Bod Pod) | 1–3 percentage points | Research and sports settings |
| Skinfold calipers | 3–5 points, operator-dependent | Good for tracking one person over time |
| Home impedance scale | 4–8 points, hydration-sensitive | Trend only; the absolute number is unreliable |
The home scale deserves the caveat it usually does not get. Impedance infers Body fat mass (FM) from how easily a small current crosses the body, which depends on how hydrated you are, when you last ate, whether you have exercised and how warm your feet are. The same person can read 22% and 27% on the same device within a single day.
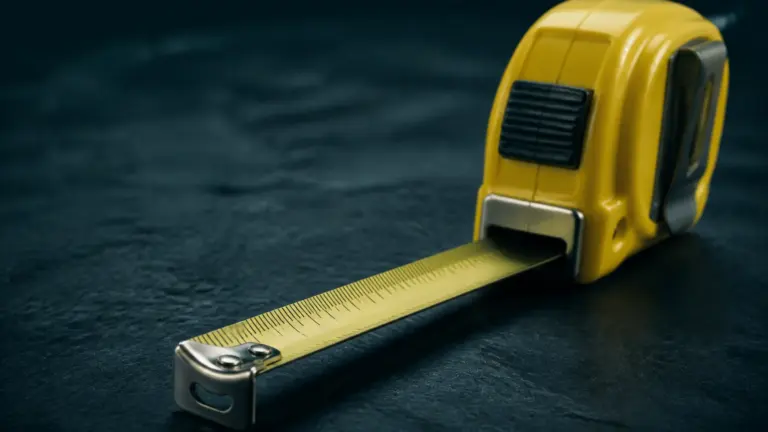
That does not make it useless — a device with a consistent bias still tracks direction correctly, which is what you actually want. It makes the absolute number untrustworthy. Body fat assessment estimates the same quantity from tape measurements instead, which sidesteps the hydration problem, and Body composition assessment splits mass into fat and lean components from the same inputs.
Which to use, and when
- Screening a population, or yourself for the first time. BMI. It is free, instant and sorts most people correctly.
- You train seriously. Body fat percentage. BMI will call you overweight and be wrong about why.
- You are over 60. Body composition, not either number alone — the muscle-to-fat ratio is what is changing.
- Tracking a change over months. Both, plus the waist. BMI catches total mass; body fat catches whether the loss came from the right tissue.
- Deciding whether to act at all. Waist-to-height ratio. It resolves most disagreements between the other two.
The reason waist arbitrates so well is that the risk being screened for is largely about fat distribution, not total fat. A body fat percentage of 30% distributed peripherally and 25% distributed centrally are not the same exposure, and the waist sees the difference that both other numbers miss.
The combination that beats either alone
Take all three, once a quarter, in the same conditions: BMI, waist-to-height ratio and a body fat estimate from whichever method you have.
Then read them as a set. All three normal is reassuring. All three raised is unambiguous. BMI raised with a normal waist and low body fat is muscle. BMI normal with a raised waist and high body fat is the pattern with the poorest outcomes and the one most likely to be missed — it has a name, normal-weight obesity, and the index will never flag it.
That last combination is the reason to bother with more than one number at all.
Frequently asked questions
Is body fat percentage better than BMI?
It measures the more relevant quantity, but every practical method has 3–8 points of error. BMI is a worse proxy measured precisely; body fat is a better proxy measured roughly.
Are home body fat scales accurate?
Not for the absolute number — hydration, food and exercise shift readings by several points within a day. They are usable for tracking direction under consistent conditions.
What is a healthy body fat percentage?
Roughly 8–20% for men and 21–33% for women in adulthood, both drifting a few points higher with age.
Can BMI and body fat percentage disagree?
Constantly, especially between BMI 23 and 30. Muscle raises BMI without raising fat, and age-related muscle loss raises fat without raising BMI.
Sources
Sources (4)
- Romero-Corral A, Somers VK, Sierra-Johnson J, et al. Accuracy of body mass index in diagnosing obesity in the adult general population. Int J Obes. 2008;32:959–966. PubMed →
- Okorodudu DO, Jumean MF, Montori VM, et al. Diagnostic performance of body mass index to identify obesity as defined by body adiposity: a systematic review and meta-analysis. Int J Obes. 2010;34:791–799. PubMed →
- Achamrah N, Colange G, Delay J, et al. Comparison of body composition assessment by DXA and BIA. PLoS One. 2018;13:e0200465. PubMed →
- Gallagher D, Heymsfield SB, Heo M, et al. Healthy percentage body fat ranges. Am J Clin Nutr. 2000;72:694–701. PubMed →
Disclaimer. This article is for information only and does not replace medical advice. Talk to a qualified clinician before changing anything about your health.